User Experience work in Québec
ou petit Précis graphique de l'approche expérience utilisateur
since janvier 2014, by maxime bodereau
Introduction
I have wrote this book in response to graphic nedd to fuse elegantly Ux and Ui. This guide adresses to Graphic Designers, Ux researchers from all horizons, and all Pixel Creators must know some Ux. This is also a graphical quick resume to explain what Ux is to curious people.
This is also my portfolio. Maxime Bodereau
Discover your company
Inside the firm, the everyday-job is UX Evangelisation.
When I arrived, I wasn't sure that I made a good move. The Firm seems to be a kind of old-school with heavy process to make any software changes. Clients are Tax Lawyers, you know, they have a "no-change" reputation.
e.g My job was understand the actual old existing sofware (in Delphi7) and provide a new interface (in Saas).
Challenge accepted. Be kind, be aware, be open, listen and know the constraints.
Don't be a graphic designer who works on shiny, rather create shiny.
Planning
With a challenge like this, good planning is important. Really ? No... Don't lose your time on that. See Titles below ? it's your calendar.
Planning, it's doneGuide Ux
Selecting the firms
Interview Users for Persona
Persona
Moodboard
Benchmark
Business Intelligence
Datavizualisations
Workflow
Material Design
Validation
Participatory Design
Now i'm clear on this issues, let's work. The first challenge is to know customers. You have to know some things:
The Global Process in a Firm : The software in use in that Company look for input to output. Disregard the software is a tiny part of an bigger process. Keep that in mind, write it, it will be your workflow first step)
With the help of marketing department, find every kind of Firms that use your software :
- Small to Big.
- Young to Old.
- Create your own segments and refine to pick some interesting Companies
- Choose one of each segment found.
- Take Rendez-vous / Arrange Meetings.
- You think Customers are sufficient ? Don't forget your Customers' users.
Good, let's create a tool for your Company, to explain what and why it's important to see the behaviours of your customers ( i mean not only superiors ). Your Collegues and all person interested inside.
Base on the above, i choose to create a Ux Guide book, because it's easier to take notes when you are in front of someone. But if you are more techie maybe create a tablet app, etc... One day I think I will transform mine into a nodejs app.
Let's create our Ux Guide
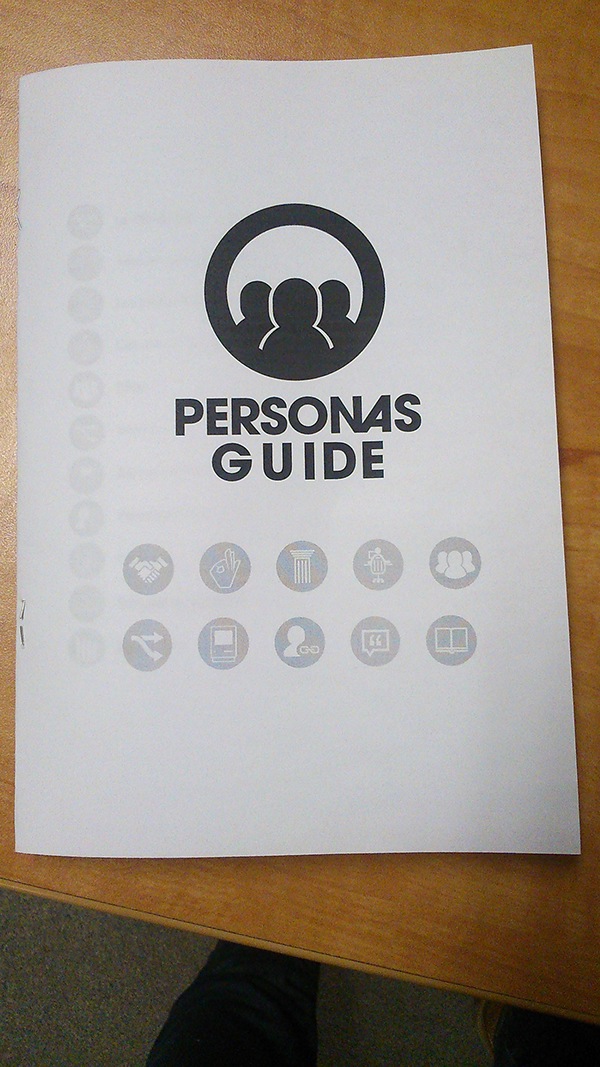
With the help of the Ux team and some reading materials1 about this topic, create a leaflet. To date, I used a notebook and a black pen.
I created the leaflet with Indesign, and the icons with Illustrator.
To be more visual, you can find additionnal steps on this page of my portfolio.
Here is a Photoshop example for better visualisation:
Tip: Print your Book cover on A3 and hang it up in your office. Share your work with everyone.
What you need inside your UX Guide Book:
- Reasons to make a Guide Book, and for whom.
- How to behave in front of someone.
- Observe the behaviour of the person.
- The workers location in the Company.
- Describe the sequences activities and processes.
- Workflow.
- Your user's technological environment ( smartphone, tablet, desktop... ).
- List of people you have met.
- Quotes.
- Some blank note pages.
- Ressources of the book. 
and eleven versions of this book later...
Selecting the firms
The Tax and accountant market is definined by its complexity and the numerous actors who are competing. The existing platform was so complex that we approach the market as a whole and we are targeting all the professionnal accountant offices from the lone practionner to the biggest national firms. It means a very large range of users, with various profiles !
Unfortunately we haven't data about the structure of the market, our clients and our users. In order to select a representative range of our users to visit we had to compensate this lack of informations to determine what was the market and the segments we are targeted. To do so, we had to rely on the little available data we had: The register of the people who participates to the fiscal seminars organized each year by Wolters Kluwer.
This is the 3 data we used:
- Do they come from Québec or the Rest of Canada
- The number of active Taxprep licences there is in each office
- The year when the office buy for the first time the product.
The data visualization we create was simple:
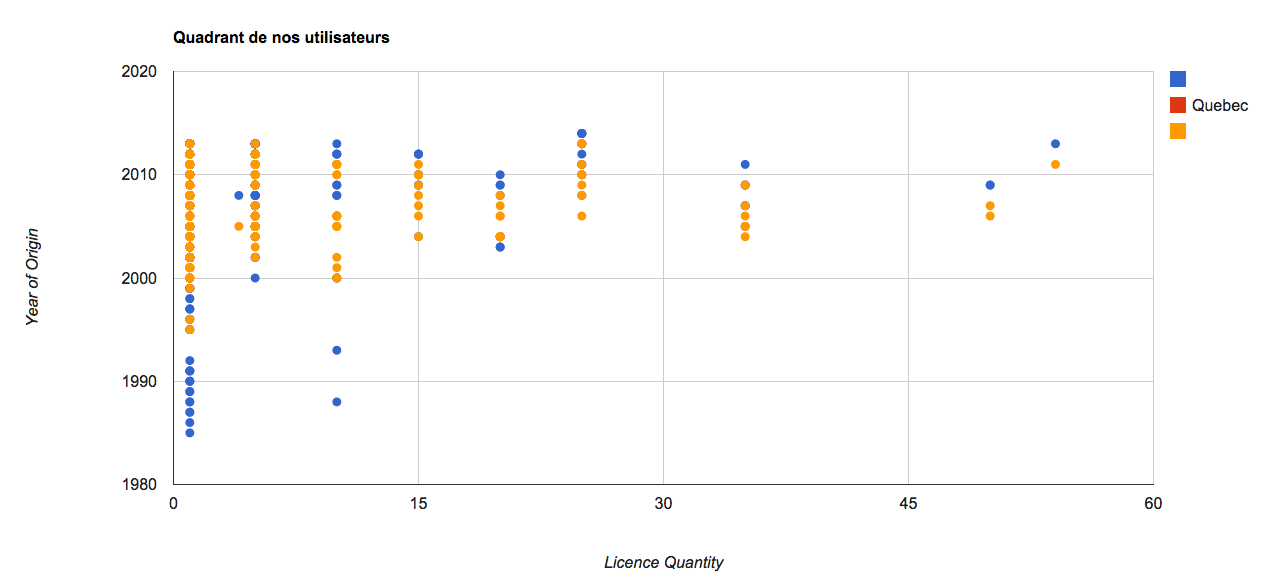
The lessons we can learn form this chart, is that :
- Our client's structure is pyramidal.
- We have more clients frome ROC than from Québec even if Cantax manage the tax issues of Québec.
- There is strong constrats of profiles inside our client's structure.
The next step was identifying the differents profiles of our customers. So we divide in 5 parts our customer pyramide, and rate the interests they represent for us in order to pick up the profile of office we will be visiting.
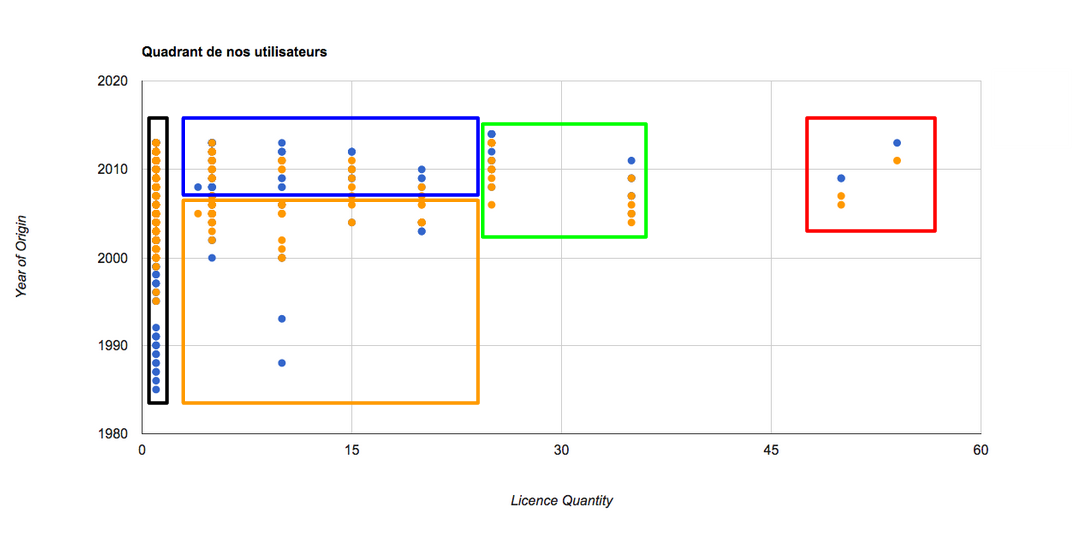](market2.png)
- Black frame : The lone practioners, they are not the type of customers we are targeting even if they represent an important part of our customers.
- Orange frame: It represents also a large part of customers but they do not change the type of product they are buying to the company since a long period of time. It may means that they are not looking for growing theirs businesses, we may extrapoled that the associates are going to retired soon.
- Blue frame: This part of our customers is interesting, they represent the offices which are renewing there range of product very often, it means they are interested by growing their business but their size is still small. So we conclude that there is a lack of maturity which doesn't allow them to overcome the peak of 30 employees.
- Red Frame: They are the National firm, they represent our major target. It was imperative to visit them.
- Green frame: It is the most interesting office for us to visit because on the market they are the offices which know the biggest growth. So much growth that there is a wave of takeover from national firm over these medium-sized firm. It means that theirs process are the most opyimized and they are productivity-oriented. Knowing how they work will help us to design the most efficient tool.
After this small analysis we drawed up the list of the office we wanted to visit.
Interviewing Users
Now, the fun part of Ux.
Make appointments with your selected Firms. Four were enough for me.
Tools to bring :
- Don't forget you manual.
- Pencils.
- Take Photos.
- Small Video recordings.
- Steal some papers, manuals, and leaflets from the firm.
- Bring everything you want and be creative.
And, as you know, observation is everything.
Persona
Good, you have gathered sufficient material, it's never too much.
Read your notes, read the collegues' notes.
Arrange for meetings with collegues and other intersted people. Give life to your Personae. In a meeting don't get into details; it will kill you.
The tooling part
Create an Excel-like sheet, my advice is Google, because it's a sharing tool. But you're free to choose.
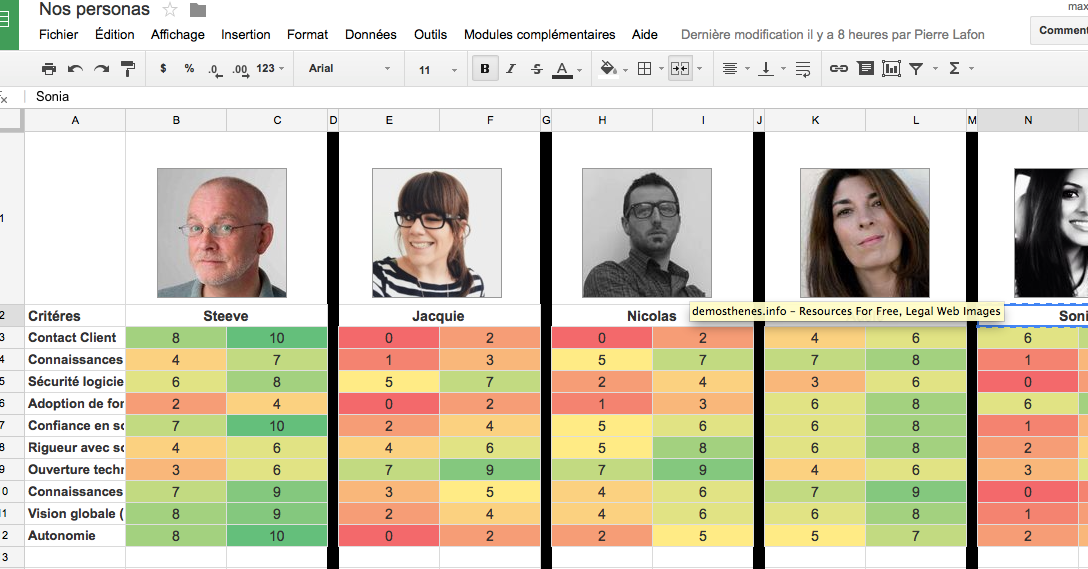
Go to ui-names for find appropriate names.
Find avatars on ui-faces.
You can find a good template for your Persona here. I recommend that you read books that give you the ability to personalize the caracteristics of your Personas.
The output part
You have to think about printing your personas on A4 and hang them on walls all around your firm.
Be creative. It's your battle ground.
And don't forget your customers. Create a public website, see below. Of course, don't share everything, select "la crème" of what you want to provide:
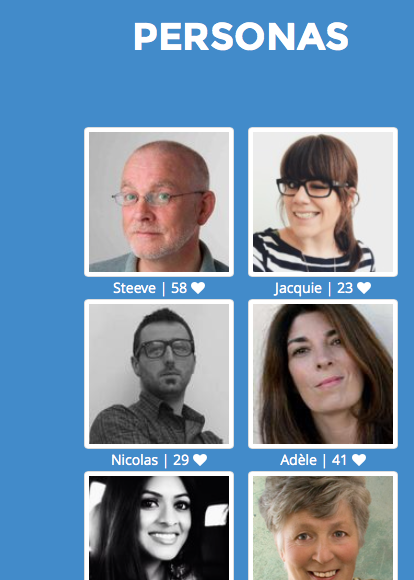
The website is made with a twitter bootstrap and some code snippets.
Want to see more? Create .json from google spreadsheet with tabletopjs and jquery, to auto-update personas.
Push further? Add some datavisualisations with D3.js. I often add web-diagrams to quickly understand the strengths and weaknesses of my persona.
Moodboard
This is a nice portion for graphic designers.
Here too, you have to think, on the one hand your company and the other hand for customers.
During a brainstorming, list adjectives, feelings and actions representing your software.
It's your moodboard. You can make it participative but i suggest to do at least 50% of the work, because everybody can't be abstract.
A tool such as Murally can help you.
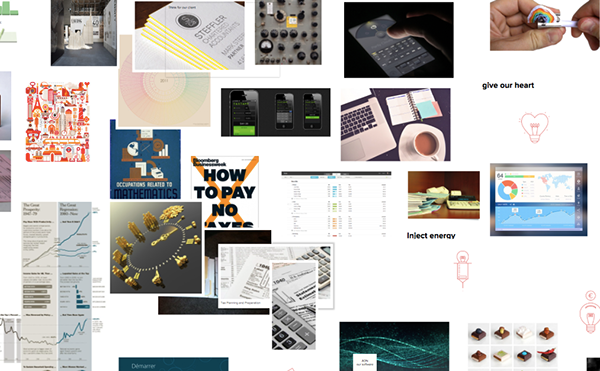
Above is an example moodboard for a Tax Software.
Find niice images for you moodboard.
And add some marketing words.
You can print yours in giant size, and write on it to improve the board.
Benchmark
Garde toujours tes amis près de toi et tes enemis, encore plus près.
Always keep your friends close to you and ennemies even closer. Al Pacino
Now that you understand the inner ecosystem, you then have to know the competitive firm's ecosystem. Benchmarking will help you.
Open a spreadsheet or excel, and list the competitive firms. Add some points of interest, put them into columns and compare them. Even your software. It will give you a good departure point.
Take the three most interesting adversaries:
- Test and try their solutions and software.
- Take Screenshots of websites, apps and features.
- Create the moodboards on A3 with the screenshots and marketing stuff, such as baseline or keywords.
Print, hang, and share in your firm.
Business is Intelligence
Keep metrics in mind all along the project.
"Key Performance Indicators" are made to give you the NSA control on a deltaplane. Big Data, small data, who cares? Search for valuable and reliable information. Mix them into a powerful control panel serving your needs.
List groups of valuable data, reorganize and draw wireframes to look for a good solution.
Making it in 'strator, gives you beautiful wireframes adapted to your environment, convert into .html to have a beautiful website, plug jquery, send to your oriented-server developper and voilà.
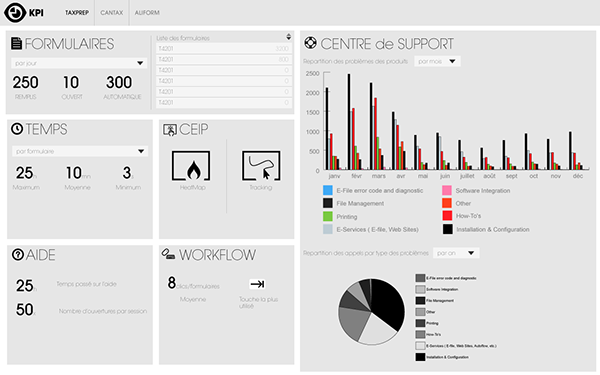
For this project I have to deep dive into:
- 5 years of data.
- 500,000 .xml files.
- Extract valuable data.
- Create Wireframes.
- Create html5/css/jquery.
- Use velocityjs to add animations to data.
K.P.I. will give you the strength and accuracy to make decisions, and improvements for your app.
Share and learn:
You have your valuable data, but it's not enough. Insert the Product Owner in the loop, wait for feedback, and iterate.
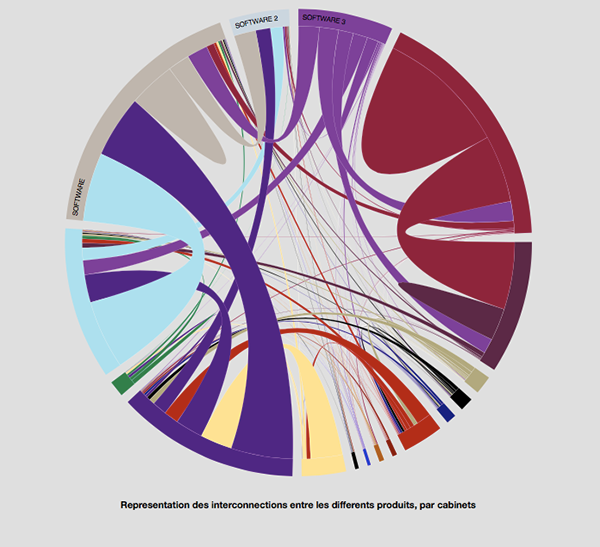
Datavisualisation
Why this chapter? With the benchmark, you have to understand the essential of interpreting data into graphic elements, to explain value easily.
As Ux you will represent the interactions between Personas, Users and Software.
Begin with Software. For my part my compagny owns multiple versions of the same software. My example below is to point out interactions between them:
In Software, challenge is to combine functionalities in group modules. See example below:
- Input
- Import
- Create
- Output
- Export
- Client Management
- Versioning
- Verification
- Search and Help
- Administration
- Create .html card for each module
You already have Personas. And you have the workflow of each user in a firm. Define your own user roles :
- Administrator
- PowerUser
- Client Manager
Assemble Modules, Personas and User Roles. See how it all works together...
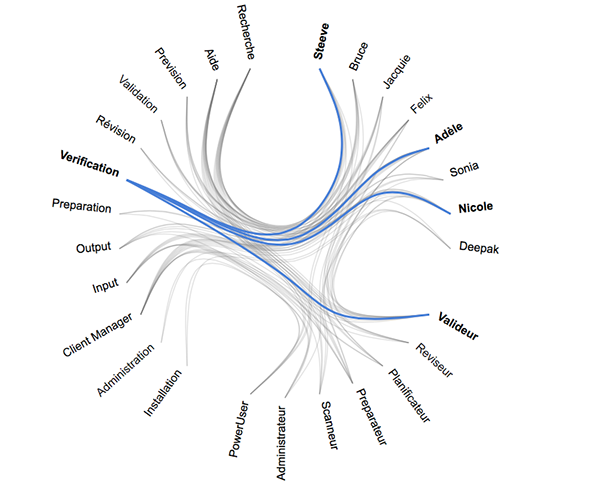 Hierarchical edge bundle, made with d3js
On this chord diagram you can see Modules top left, Personas top right, User Roles bottom right, and the blue link between them.
Begins to be lighter, isn't it ?
Share with interested people and ask for their feedback.
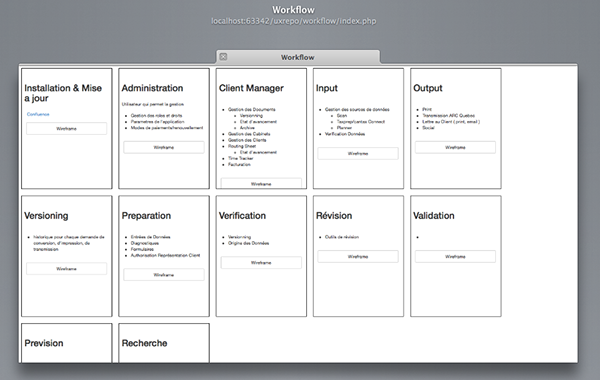
Holons Workflow
I present to you the Holons. This term comes from Holacracy2.
Re-use the group module board:
- Create subpages for each holon.
- List all actions. ( if software help exists use it )
- Each card contains a full feature description.
Create two parts in each holon, one for Wireframe and the other for Ressources.
Use bootstrap twitter to help you create the interface. Begin structuring the hierarchy of the holon.
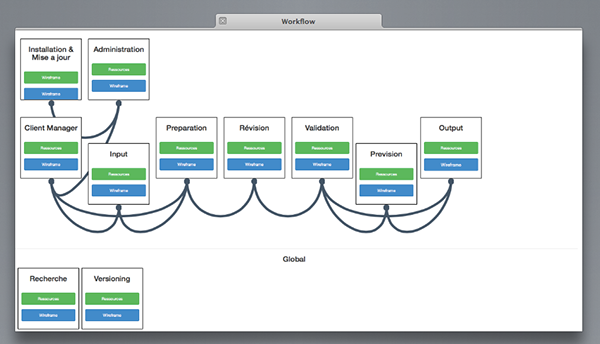
Add jsplumb to link and make them draggable and voilà !
Material Design
It needs ui skills.
Validation
Participatory Design
Playground
1. Addiction by Design | Auditory Interfaces | Designing for the Digital Age | The Design of Everyday Things | The Guide to Wireframing by UXPin ↩
2. Holacracy for Beginners ↩